Wetland Monitoring Tool
Wetland Monitoring Tool (WMT) is an innovative, free-to-use remote sensing and GIS-based platform designed to monitor, map, and analyze seasonal changes in wetland ecosystems across Southeast Asia.
WMT is a cloud-based platform that uses satellite data and generates seasonal composites and applies vegetation and water indices to track surface water extent, vegetation, and wetland changes over time. The tool offers a user-friendly interface for visualizing trends and identifying areas experiencing significant seasonal or long-term change—supporting community stakeholders, scientists, and policymakers in sustainable wetland management, biodiversity conservation, and climate adaptation planning.
Explore WMT
FAQ's
Why the tool matters
Wetlands are among the most productive ecosystems in Asia, providing critical services such as water storage, flood regulation, carbon sequestration, and habitat for biodiversity. However, rapid land use change, infrastructure development, and climate variability are accelerating wetland degradation—threatening livelihoods, water security, and ecosystem resilience.
The Wetland Monitoring Tool (WMT) offers a practical, science-based solution to track and analyses seasonal and long-term changes in wetland areas using remote sensing data. By integrating vegetation, water indices, and land use information, the tool helps identify wetland loss, land use change, max surface water extent of wetland systems. This will support government agencies, researchers, and local communities in prioritizing restoration efforts, planning sustainable interventions, and enhancing climate resilience in vulnerable wetland ecosystems.
How it can be used by stakeholders and policy-makers
WMT is a valuable resource for stakeholders involved in wetland conservation, water resource planning, and land-use management. It provides yearly updated and long-term information on wetland extent, vegetation, and hydrological change, enabling users to assess the impacts of land-use activities, infrastructure development, and climate variability on wetland ecosystems.
Government agencies such as State Wetland Authorities, Environment Departments, and Water Resource Departments can use the tool for rapid assessment of wetland degradation, prioritize areas for restoration, and monitor compliance with conservation policies. The historical dataset helps identify trends and hotspot areas where intervention is urgently needed.
Additionally, WMT can support planners and decision-makers in integrating wetland ecosystem services into development planning, ensuring the protection of critical habitats and the sustainability of agriculture, fisheries, and local livelihoods. The tool’s outputs can be further enhanced by incorporating demographic, infrastructure, and land tenure data to support inclusive, evidence-based policy decisions.
How the tool works
Overview
The Wetland Monitoring Tool (WMT) harnesses cloud-based remote sensing technologies and open-source satellite imagery to monitor and map seasonal and long-term changes in wetland ecosystems. The tool uses satellite data from Landsat to generate year composites and applies vegetation and water indices—such as NDWI, NDVI, and MNDWI—to detect open water, wetland vegetation, and seasonal fluctuations in surface water extent.
WMT includes a threshold-based classification system that enables users to differentiate between permanent and seasonal wetlands, track vegetation dynamics, and identify areas undergoing degradation or land-use change. The tool integrates these spatial datasets into a user-friendly interface, allowing stakeholders to visualize changes over time, compare trends between seasons, and export data for further analysis.
By combining consistent satellite data with ecological indicators, WMT delivers reliable and actionable information that supports timely decision-making for wetland conservation, restoration planning, and sustainable landscape management.
Data Sources and Methods
The Wetland Monitoring Tool integrates multiple high-quality remote sensing datasets and established methodological approaches to provide comprehensive wetland monitoring capabilities. Below are the key data sources and methodologies employed in our analysis:Global 30m Wetland Classification (GWL_FCS30)
This dataset provides high-resolution wetland classification maps at 30m resolution.
Citation: Zhang, Xiao, Liangyun Liu, Tingting Zhao, Xidong Chen, Shangrong Lin, Jinqing Wang, Jun Mi, and Wendi Liu. "GWL_FCS30: global 30 m wetland map with fine classification system using multi-sourced and time-series remote sensing imagery in 2020." Earth System Science Data Discussions 2022 (2022): 1-31. Data Source: Liangyun, L., & Xiao, Z. (2023) – Zenodo: https://doi.org/10.5281/zenodo.10068479
JRC Global Surface Water
Provides long-term surface water occurrence and dynamics (1984-2015). Used for permanent water body identification (>90% occurrence).
Citation: Pekel, Jean-François, Andrew Cottam, Noel Gorelick, and Alan S. Belward. "High-resolution mapping of global surface water and its long-term changes." Nature 540, no. 7633 (2016): 418-422.
CHIRPS (Climate Hazards Group InfraRed Precipitation with Station Data)
Provides high-resolution precipitation data from 2000-2024
Citation: Funk, Chris, Pete Peterson, Martin Landsfeld, Diego Pedreros, James Verdin, Shraddhanand Shukla, Gregory Husak, James Rowland, Laura Harrison, Andrew Hoell & Joel Michaelsen. "The climate hazards infrared precipitation with stations-a new environmental record for monitoring extremes". *Scientific Data* 2, 150066. doi:10.1038/sdata.2015.66 2015.
WorldPop (Population data)
- High-resolution population distribution data at 100m resolution
- Used for assessing human pressure on wetland ecosystems
Data source: WorldPop (www.worldpop.org)
The tool utilizes multiple satellite-derived indices for wetland monitoring:
Normalized Difference Water Index (NDWI)
Specifically designed to maximize the reflectance of water by using green wavelengths and minimize the reflectance of NIR by water features. Effective for detecting and monitoring water bodies and moisture content in wetlands. Values range from -1 to +1, where higher positive values indicate water bodies.
McFeeters, Stuart K. "The use of the Normalized Difference Water Index (NDWI) in the delineation of open water features." International journal of remote sensing 17, no. 7 (1996): 1425-1432.
Modified Normalized Difference Water Index (MNDWI)
An enhancement to NDWI that uses SWIR instead of NIR to better distinguish water from built-up areas. Particularly effective in areas where water bodies are mixed with built-up land. Provides improved water body extraction with reduced noise from built-up areas
Xu, Hanqiu. "Modification of normalised difference water index (NDWI) to enhance open water features in remotely sensed imagery." International journal of remote sensing 27, no. 14 (2006): 3025-3033.
Normalized Difference Vegetation Index (NDVI)
Measures vegetation health and density by analyzing the difference between near-infrared and red-light reflection. Essential for monitoring wetland vegetation dynamics and health. Values range from -1 to +1, where higher positive values indicate healthy vegetation. Particularly useful for tracking seasonal changes in wetland vegetation.
Rouse, J. W., R. H. Haas, J. A. Schell, and D. W. Deering. "Monitoring vegetation systems in the Great Plains with ERTS. 1974." In Proceeding Of Erts‐1 Symposium. 1974.
Bare Soil Index (BSI)
Used for detecting bare soil areas and soil moisture conditions in wetland environments. Combines blue, red, near-infrared, and short-wave infrared bands. Helps identify areas of soil exposure and potential wetland degradation. Useful for monitoring wetland conversion and degradation processes.
Rikimaru, A., Roy, P.S., Miyatake, S. (2002). Tropical forest cover density mapping. *Tropical Ecology*, 43(1), 39-47.
Tasseled Cap Wetness (TCW)
Provides information about soil and canopy moisture content. One of three components in the Tasseled Cap transformation (along with brightness and greenness). Particularly sensitive to soil and plant moisture. Effective for monitoring wetland hydrology and moisture dynamics. Useful for detecting changes in wetland extent and condition.
Crist, E.P., Cicone, R.C. (1984). A Physically-Based Transformation of Thematic Mapper Data—The TM Tasseled Cap. *IEEE Transactions on Geoscience and Remote Sensing*, GE-22(3), 256-263.
We acknowledge the use of data from various sources as cited above. This tool wouldn't be possible without the contributions of these research teams and organizations.
Code and Data Availability
The source code for the Wetland Monitoring Tool will be made available on SEI GitHub. Additional data and resources can be made available upon request by contacting the authors.
Learn About Wetlands
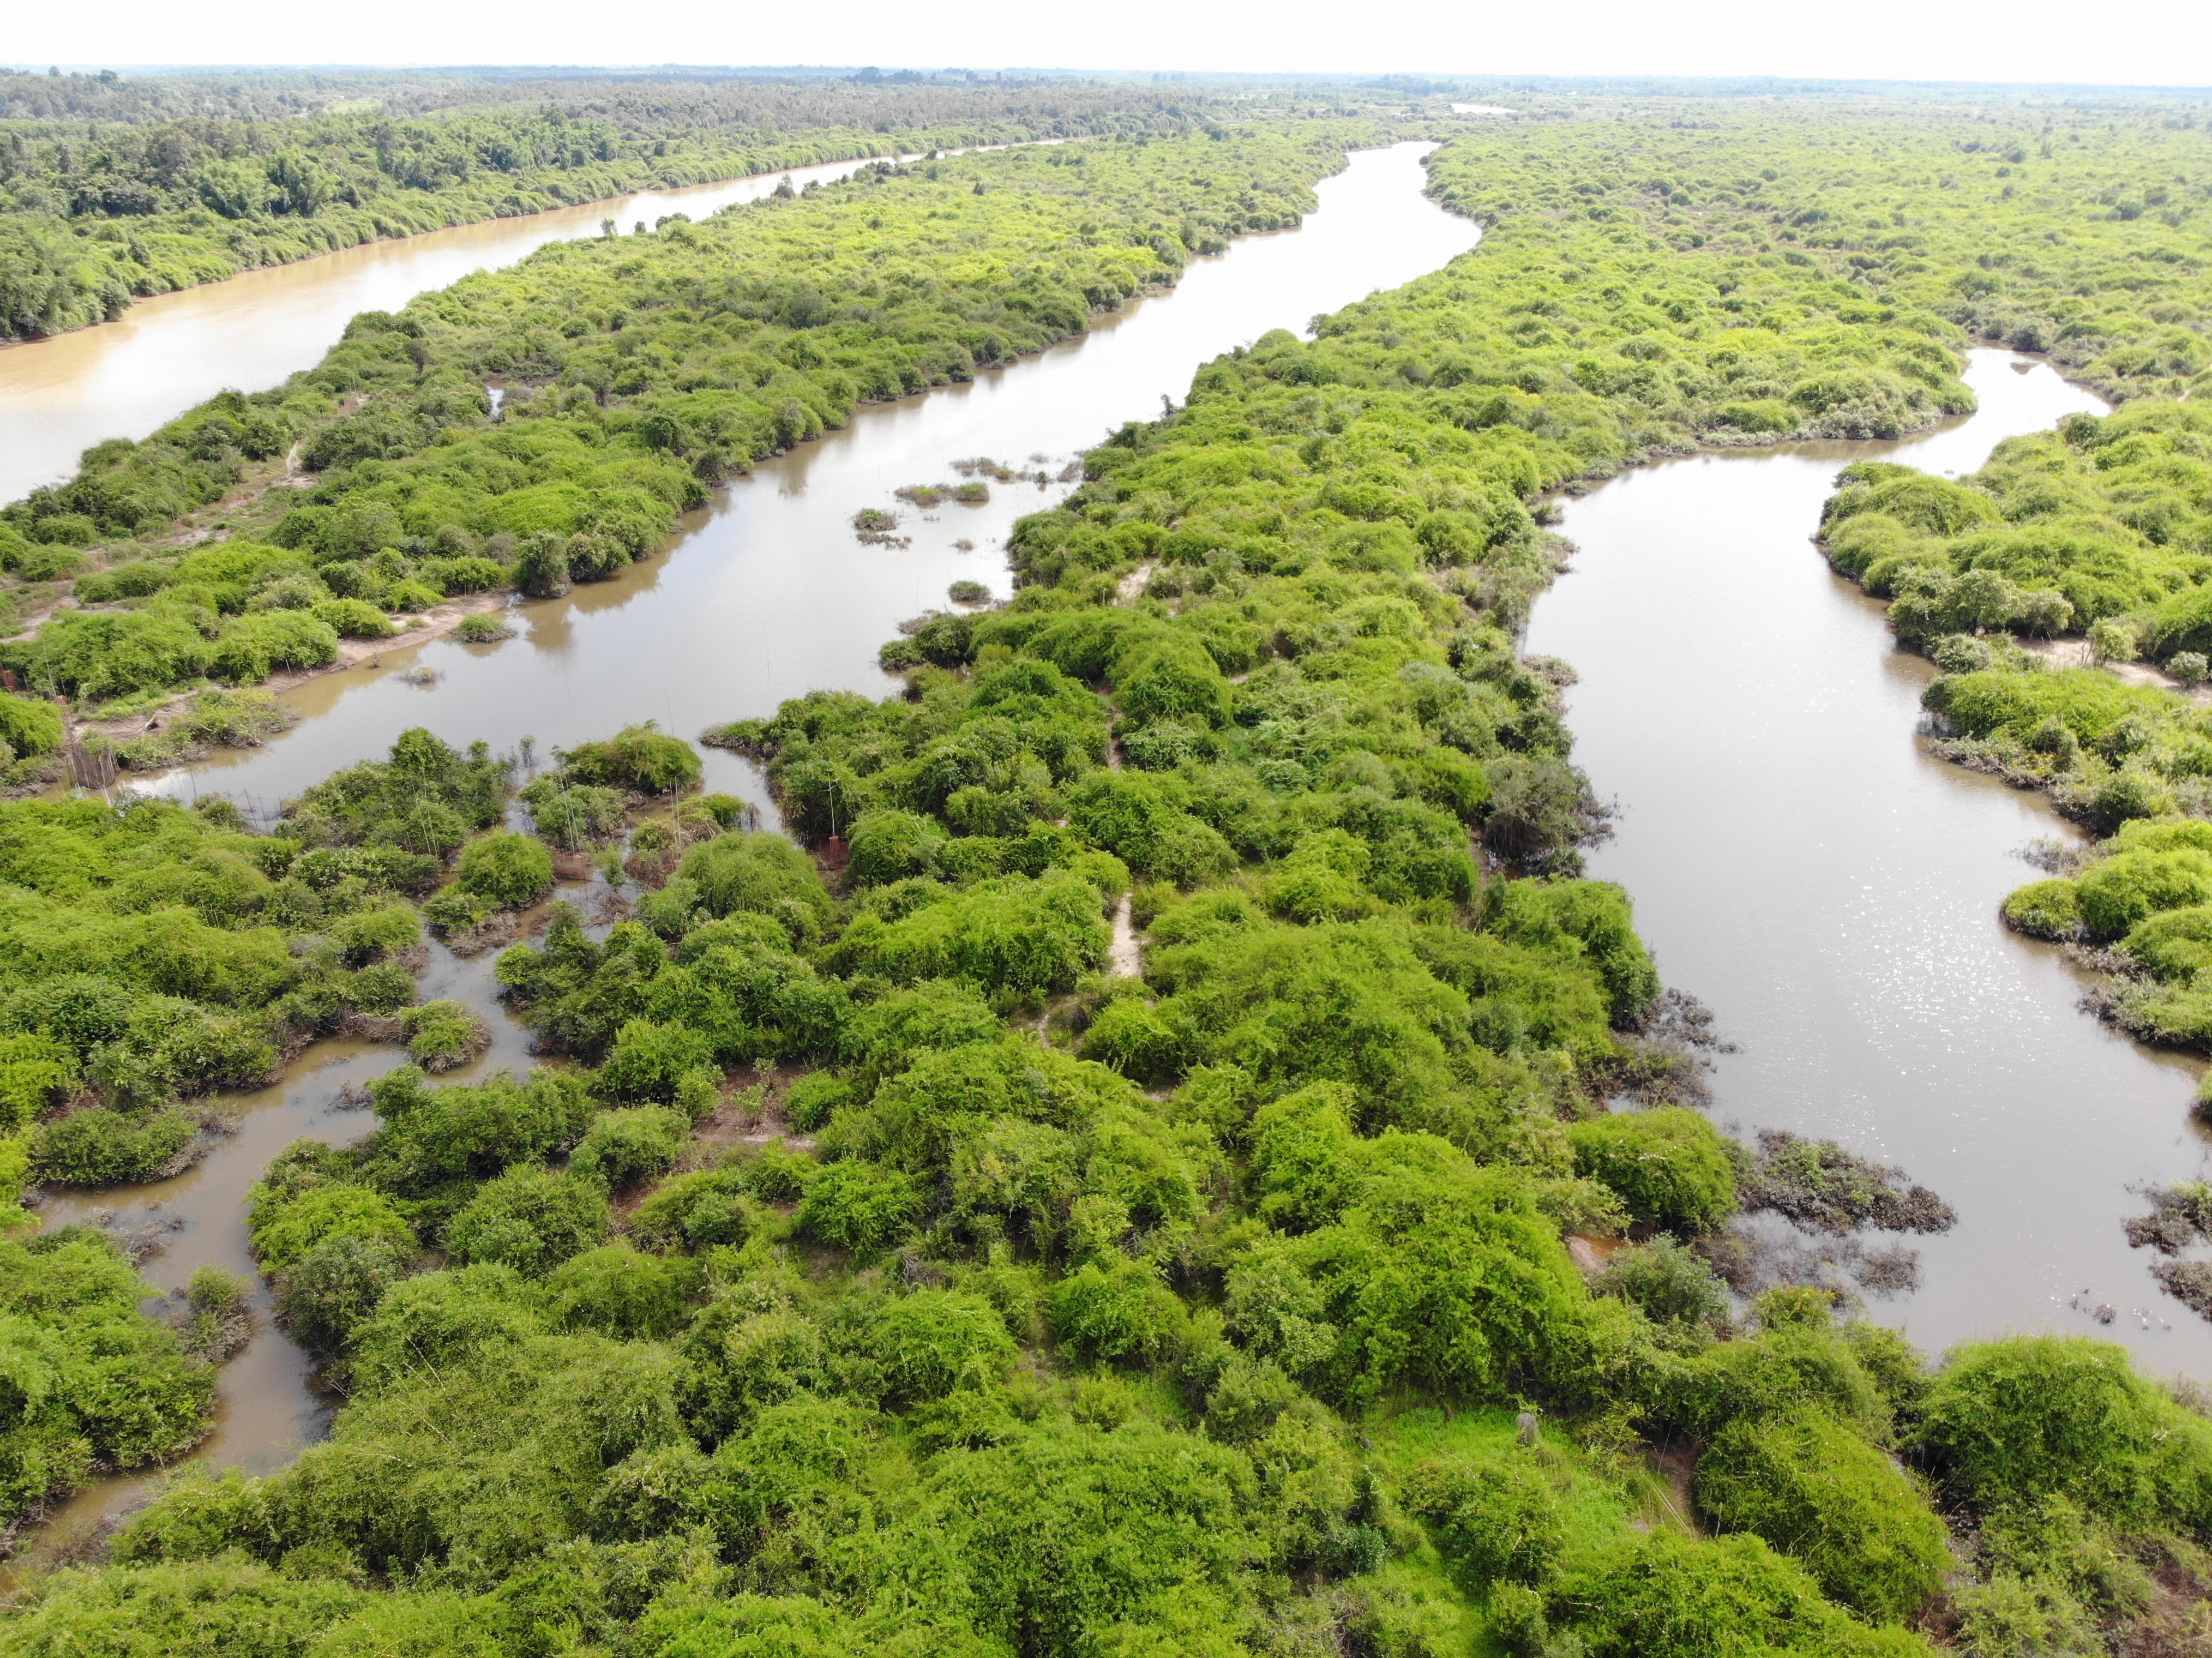
Wetlands are transitional ecosystems between land and water—such as marshes, swamps, peatlands, floodplains, and lakeshores—that play a vital role in supporting biodiversity, storing water, and regulating climate. They act as natural sponges, absorbing excess rainfall, reducing flood risk, recharging groundwater, and filtering pollutants from water.
Wetlands are also home to a diverse range of species and provide essential resources for millions of people, including food, water, and livelihoods. However, they are among the world’s most threatened ecosystems—drained, degraded, or lost due to land-use change, urbanization, and climate impacts.
Monitoring wetlands is essential to understanding how they are changing over time and what actions are needed to protect them.
Visit www.ramsar.org to learn more about wetland and get more information on wetland of internation importance.
Main funding sources
Wetland Monitoring Tool is developed under the funding from SEI Tools and Method Fund and Support from Transboundary Rivers of South Asia (TROSA) Phase-2: Rivers, Rights, and Resilience (T2:3R) project implemented by SEI and led by Oxfam Novib, funded by the Swedish government.